


Data study, Nov 2026, Maricopa County records
2027 county values fell for 63% of Mesa homes, but taxed values rose 5%
The county's estimate of market value dropped for most Mesa homes in the 2027 notices. The value that property taxes are usually based on still went up 5% for almost every one of them. Here is why both can be true.
Two values, not one
63% of Mesa homes
Got a lower county market-value estimate for 2027. The median change is -1.5%. Tax year 2027 Notice of Value compared with 2026. Maricopa County Assessor. 158,084 Mesa residential parcels.
Every Mesa home carries two values at the county. They answer different questions, and they do not move together.
Full cash value is the county's yearly estimate of market value. Arizona defines it as the value determined by statute, otherwise market value derived annually with standard appraisal methods, and never greater than market value (ARS 42-11001(6)).
Limited property value is the number property taxes are usually based on. By law it is the preceding year's limited value plus 5% of it, and never above the current full cash value (ARS 42-13301(A)-(B)). The Maricopa County Assessor describes property taxes as "usually based on" limited value rather than market value.
So the arithmetic works like this. Say a home's market estimate slips 2%. If its taxed value was already well below that estimate, the 5% step still fits under the ceiling, and the taxed value goes up anyway.
That is what happened to 62.7% of Mesa homes. The median home's taxed value is 55.3% of its full cash value, and 32.7% of homes are taxed on less than half of it. Only 0.14% are taxed at the full market-value estimate.
Exceptions exist: new construction or demolition of 15% or more of value, lot splits or combinations, a change in use, or loss of a special valuation. Limited value is then reset (ARS 42-13302(A)) and can go down or up. Roughly 1% of Mesa homes are neither at the cap nor equal to full cash value, which fits that group.
How the county's market estimate moved
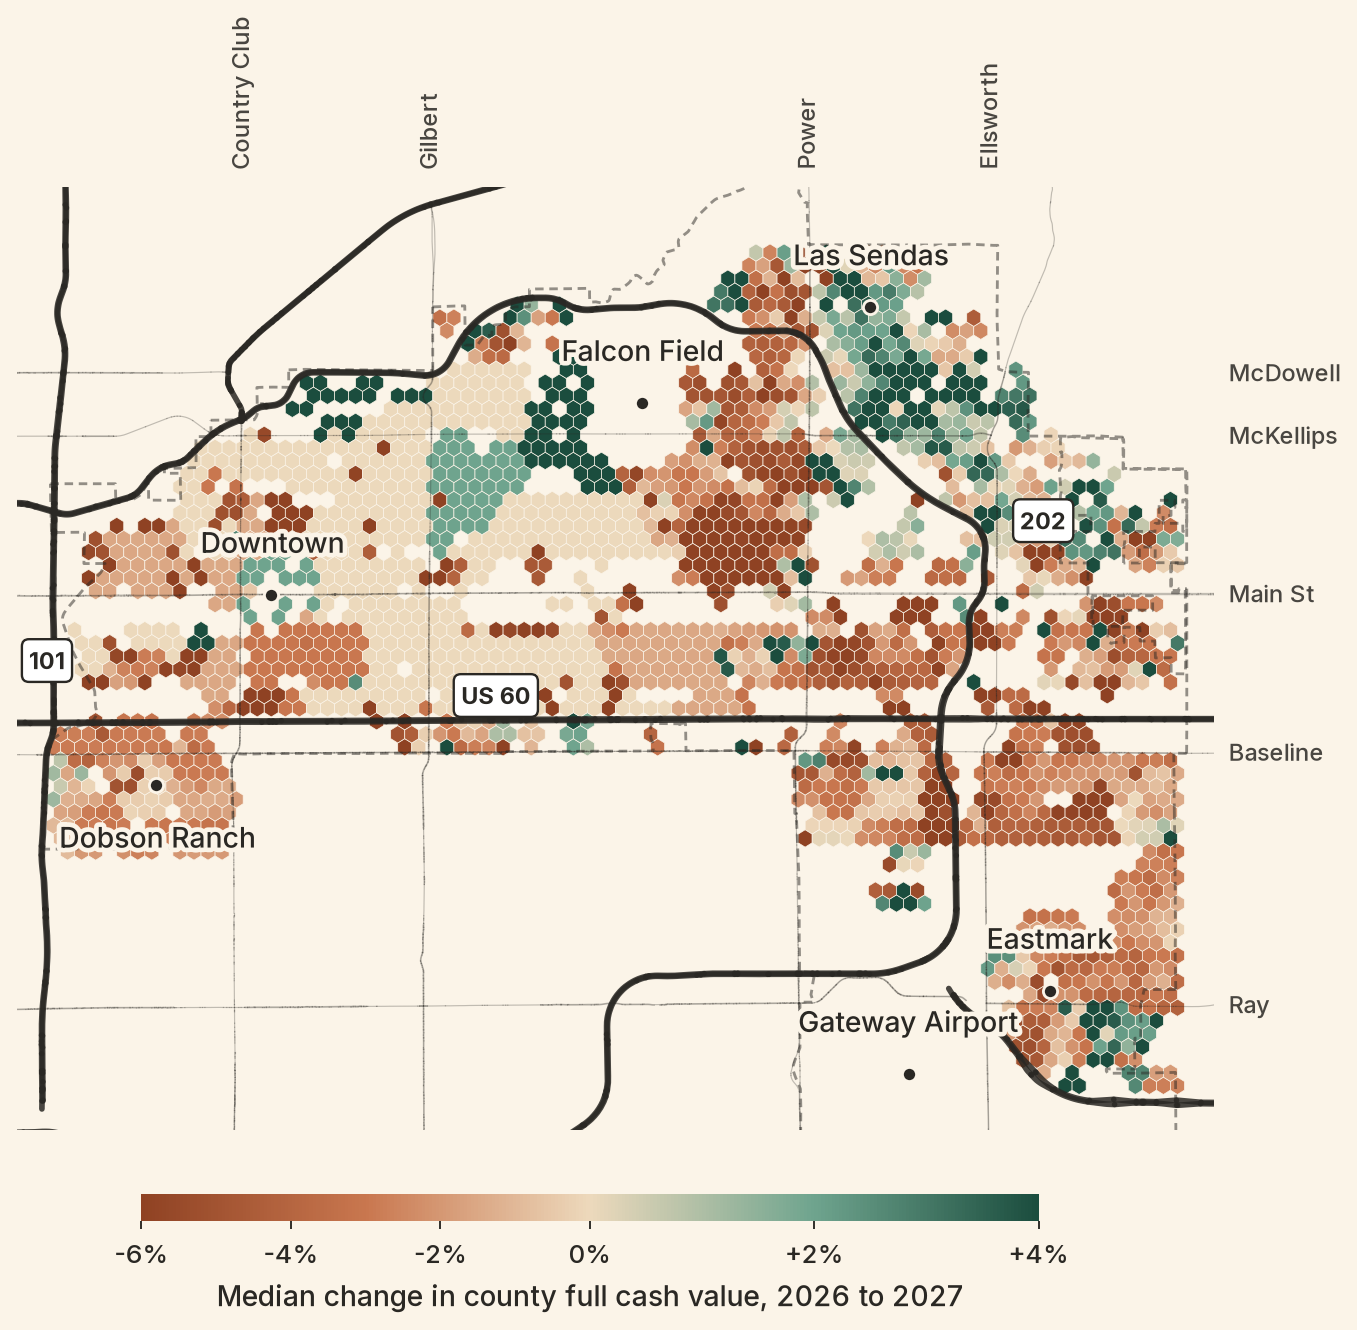
How the county's full cash value changed for Mesa homes, 2026 to 2027
The taxed value barely noticed
Median change in full cash value and taxed value, Mesa homes, 2026 to 2027
The two lines run in opposite directions because they follow different rules. One is re-estimated every year. The other is a step of 5%, held under the first.
Where values fell
By ZIP code
Within one ZIP the changes cluster by neighborhood, which fits a value set neighborhood by neighborhood. That is an observation from the data, not a documented assessor method. ZIPs 85208, 85209 and 85210 saw nine in ten homes drop. 85203 and 85204 mostly held flat. 85207 is the only ZIP where more homes rose than fell.
| ZIP | Homes | Median full cash value, 2026 to 2027 | Median change | Fell | Unchanged | Rose | Taxed value as % of full |
|---|---|---|---|---|---|---|---|
| 85208 | 9,482 | $321,500 to $309,300 | -3.41% | 89.6% | 1.9% | 8.6% | 53.7% |
| 85205 | 13,974 | $345,300 to $333,300 | -3.08% | 70.8% | 16.8% | 12.3% | 55.5% |
| 85209 | 15,296 | $378,800 to $364,800 | -3.02% | 91.3% | 1.8% | 7.0% | 61.3% |
| 85215 | 7,009 | $422,100 to $408,300 | -2.94% | 75.1% | 1.7% | 23.2% | 63.3% |
| 85210 | 9,027 | $309,600 to $302,200 | -2.85% | 91.0% | 0.7% | 8.3% | 39.1% |
| 85212 | 20,893 | $472,800 to $464,800 | -2.58% | 78.3% | 1.2% | 20.6% | 58.9% |
| 85202 | 11,079 | $334,200 to $329,000 | -2.39% | 75.9% | 13.7% | 10.4% | 48.1% |
| 85201 | 9,982 | $309,000 to $303,000 | -1.50% | 65.3% | 28.6% | 6.1% | 35.9% |
| 85206 | 12,168 | $326,600 to $321,500 | -1.49% | 67.9% | 20.1% | 12.0% | 58.9% |
| 85213 | 9,674 | $454,150 to $457,800 | 0.00% | 16.8% | 46.6% | 36.6% | 59.3% |
| 85203 | 8,729 | $369,200 to $369,600 | 0.00% | 10.9% | 81.1% | 8.0% | 50.4% |
| 85204 | 13,990 | $327,800 to $325,700 | 0.00% | 32.1% | 64.2% | 3.8% | 42.0% |
| 85207 | 16,777 | $463,000 to $469,100 | +0.48% | 40.2% | 2.2% | 57.6% | 58.0% |
Sorted by median change. "Taxed value as % of full" is the median home's 2027 limited value divided by its 2027 full cash value. Source: Maricopa County Assessor.
Newer homes sit closer to market
Homes built 1970 to 1989 have a median taxed value near 50% of full cash value. For the 1990s it is about 59%, for the 1950s and 1960s about 35% to 42%, and for the 1910s to 1930s about 30% to 32%. The older the home, the more years of 5% steps have stacked under a market value that rose faster. Homes built since 2020 sit at 57.5%. Homes built 2000 to 2019 saw the biggest drops, a median of -2.4% to -2.5%, with 72% to 76% falling.
Read this before you quote a number
- These are the assessor's estimates for the tax-year 2027 notice, with a January 1, 2026 valuation date. They can change on appeal. They are not sale prices and say nothing about next year.
- 19.6% of Mesa homes show exactly 0.0% change (81% in ZIP 85203). We count them as unchanged and did not investigate why.
- "Homes" are parcels. A condo building counts as many parcels. Single-family codes alone are 122,848 of them, and the result is nearly the same: median -1.44%, 59.5% fell, 98.8% at the cap.
- The count of 5%-capped homes assumes the standard 5% rule. Roughly 1% of homes are neither capped nor equal to full cash value.
- This page does not say what anyone's tax bill did. A bill is assessed value times a tax rate, and rates were not studied.
How we did it
How we measured it
- Started with 158,102 Mesa rows in the county residential file and matched them to the county's 2027 Notice of Value by parcel number (158,092 matched).
- Kept built homes with living area of at least 400 sq ft, a build year, positive full cash and limited values in both years, and a Mesa ZIP (158,084 homes).
- "Fell" and "rose" mean a change beyond 0.05%. "At the cap" means the limited value grew 5.0%, within 0.06 point.
- Map: each hexagon is the median change for the 15 or more homes inside it (homes without a mapped parcel point or far outside the city are left off).
Questions
Wondering what your Mesa home is worth?
Get a free home value estimate based on recent nearby sales. Or list with the Full-Service Listing for a Flat Fee for $3,995, paid at closing through escrow.
Source: Maricopa County public records, downloaded Nov 15, 2026. The County does not guarantee the accuracy of this data. Analysis by MesaHomes.com. Past records and estimates, not a prediction of any home's value or an appraisal. Real estate brokerage services by My Home Group Real Estate, LLC.